Monday, December 29, 2008

Artistic Clues to Coastal Change

"Nineteenth Century artwork is a useful tool for studying coastal erosion, according to a retired coastal engineer."
Want to read more?
Click HERE to link to the BBC website

Tuesday, December 23, 2008

Swiss Glaciers "in full retreat"

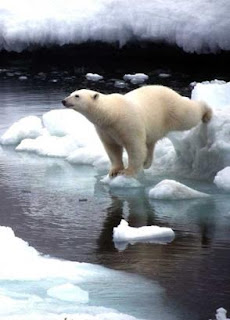
"Swiss glaciers are melting away at an accelerating rate and many will vanish this century if climate projections are correct, two new studies suggest."


Click on the link below to read more from the BBC website:


Wednesday, December 17, 2008

Measure your ECOLOGICAL FOOTPRINT

Worried about your impact on the environment?
The way we use the planet's resources makes up our ecological footprint.
Measuring yours takes less than 5 minutes and could set you on a life-changing journey...

Sea Level could rise by 150cm...


"Sea level rise due to global warming will "substantially exceed" official UN projections and could top 150cm by the end of the century, according to a report from the US Geological Survey on the risks of abrupt climate change. Such a rise would be catastrophic, seeing hundreds of millions of people affected by flooding."


Click on the newspaper link below to read more...


Climate Change: The Carbon Atlas


Click on the image above to be taken to
The Guardian's
excellent interactive carbon atlas.

Tuesday, December 2, 2008

Twelve Years to Halve UK Carbon Dioxide Emissions


Britain should adopt the world's toughest climate change target and slash nearly half of its greenhouse gas emissions in the next 12 years, the Government's new climate advisory committee said yesterday in its first report.


Click below to read more in:


Thursday, November 20, 2008

Obama brings US in from the cold

In a landmark speech, the next president pledges to revive Kyoto Protocol and end American isolationism over climate change.

To read more, click on the following link to The Independent:

Wednesday, November 19, 2008

Carbon Capture and Storage (CCS)

Carbon Dioxide and climate change...is CCS the answer?
Click on the picture above to find out more
(remember, though, focus on the chimney not the cooling towers...grrrr...!)

Tuesday, November 18, 2008

Flood water accelerates glacier flow

"Great floods beneath the Antarctic ice sheet can now be linked directly to the speed at which that ice moves towards the ocean, scientists say."

To read more of this article, visit the BBC website by clicking on the link below:


Tuesday, September 23, 2008

The Methane Time Bomb


New global warming threat as melting permafrost releases millions of tons of a gas 20 times more damaging than carbon dioxide...


Read more by clicking on the link below:
oo0oo
oo0oo

Don't miss the interesting editorial comment in the same paper!

Monday, September 15, 2008

Hurricane Ike - the story continues...

Texas begins mass post-Ike rescue


"Texas has begun what is being described as the biggest search and rescue effort in its history following Hurricane Ike..."
-
Visit the BBC Website to find out more
-
Whilst your there, take a look at some of the superb video footage.
-
In addtion, the following videos are also well worth watching:
-

Sunday, September 14, 2008

Arctic Sea Ice: more melting than ever before...


Melting ice makes new Arctic border


The rate of melting of Arctic sea ice is greater than ever before.


Watch this BBC VIDEO CLIP to learn more about ice melt and the implications for border control, international disputes and, of course, further climate change...

Hurricane Ike - the latest...

Fuel shortage fear after US storm


"Oil refineries in Texas put out of action by Hurricane Ike could take eight to nine days to recover..."


To get the latest on this news story, click on the link below:


Want to know more?

Check out the following sites:


DON'T MISS...the Guardian's excellent interactive map of the 2008 hurricane season

Sunday, September 7, 2008

North Eastern Market Town under water


Morpeth a 'scene of devastation'


"About 1,000 properties have been flooded in a Northumberland town, and more than 100 people were rescued by boat from their homes....."


To read more of this article, click on the BBC website link below:


Hurricane Ike


Caribbean lashed by Hurricane Ike


Follow the progress of this, and other, hurricanes at www.stormcarib.com


To find out how the UK's media are covering the story, click on the links below:


Monday, August 4, 2008

Climate Change: the worst WMD of them all?

A really thought-provoking article was written today in The Independent.

Wednesday, February 27, 2008

Millions wake after shake by 'quake!


Earthquakes such as that which was experienced last night don't occur very often you know - in the UK...about once every 30 years!


Find out more from the following sites:


Monday, February 25, 2008

Y12 Energy and Life Assessment - lessons to learn...


1 The difference between a habitat and a biome is all about SCALE (and complexity of structure, number of food chains, biomass...).

2 Primary Productivity is the amount of new tissue growth (measured in g/m2/year) - it is not the energy produced.

3(i) Look for overall trends as well as referring to specific figures and identifying anomalies.

4(i) You have simply got to sit down and learn diagrams such as this - know your stores and your transfers BUT remember to read the question so that you know which ones the examiners are asking about.
4(ii) READ THE QUESTION!! The output from the soil is leaching; the output from the litter is run-off...so clearly this question wants you to start by thinking about these two (and then moving on to thoughts about management by humans [harvesting, grazing etc.]).

5(i) You must pick up the straightforward marks...
5(ii) This question asked you to make reference from the graph (describe) and use your own knowledge (give reasons). With regard to the former, state "mass greatly reduced at each level - 8009, 120g, 10g etc; with regard to the latter, refer to 90% loss at each stage, energy lost as a result of respiration, movement, excretion etc.

6(a) You won't find four easier marks but you will never get them unless you learn key definitions. Ensure that you refer to the time factor when referring to succession and include examples as part of your definition of both key terms.
6(b) Describe: Number of Species - rapid increase then decline (state specific figures to get more marks). Rate of Growth - two rapid phases with slower (plateau) periods. Biomass - steady then rapid increase (20-100 years) then slows.
Explain: Number of Species - increasing diversity as conditions become less extreme (milder microclimate, better soils etc.). Shading out of species from 50 years onwards. Rate of Growth - reflects plant number/density, height, layering - i.e. rapid colonisation and stability of initial species, then colonisation by bushes and trees. Biomass - reflects number, density and type of species as conditions change.

7 Human arresting factors: deforestation, afforestation, agriculture (arable and pastoral), forest fires.
Natural arresting factors: volcanic eruptions, mudflows, hurricanes, forest fires (caused by lightning).
If you only wrote a list such as this, you would not get more than 5/10. In order to get 6+/10, you must examine in more detail. For example, after stating "strong winds/hurricanes" as a natural arresting factor, you would need to explain why, stating that: "Strong winds will uproot the largest trees and damage other vegetation layers closer to ground level. Whilst this may not completely arrest the succession, it will certainly represent a major interruption to the normal development of the vegetation, not least because the largest trees (the climatic climax vegetation) are now no longer present."

Thursday, February 21, 2008

Y10 - Read this to improve the writing of your METHODOLOGY!


Think about the following:
  1. WRITE IN DETAIL - say exactly what you did and how you did it
  2. Include screengrabs and images if possible to help explain what you did
  3. Don't forget to include details of the GIS an and Sampling
  4. When writing about WHY you used a certain method, remember to refer back to your original hypothesis (you are trying to prove or disprove it it remember!)
  5. You must include your methodology for individual secondary data collection too
  6. Include examples of data collection sheets, tables of land use categories etc. to prove exactly what you used on the day
  7. Check the wording and the tense...


Wednesday, February 6, 2008

Death toll rises from US tornado strikes

"Authorities are checking for additional victims of tornadoes that killed at least 26 people, ripped the roof off a shopping mall and blew apart warehouses as they tore across four US states."

Click on the picture above to read more of The Independent's article...


Bali Climate Change Conference: the basics...


Click on the image to find out more...

Tuesday, February 5, 2008

Scientists identify 'tipping points' of climate change


Nine ways in which the Earth could be tipped into a potentially dangerous state that could last for many centuries have been identified by scientists investigating how quickly global warming could run out of control...


To find out more, click on the picture above and read The Independent's full story...

The World's Biggest Rubbish Dump...

Click on the Image above to find out more...

Friday, February 1, 2008

Eigg-citing times for tiny Hebridean Island!

"The tiny Hebridean island of Eigg has never had a mains supply of electricity, relying on micro-generators to power its crofthouses and small businesses. So what's the feeling ahead of the big switch-on?"


To find out more, click on the picture and read the full story at bbc.co.uk/news...

Thursday, January 31, 2008

Britain will need 12,500 wind farms to satisfy EU targets

[Jeff J Mitchell/Getty Images]

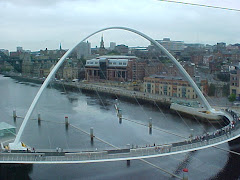
"A rapid and vast expansion of renewable energy is on the way in Britain to help with the fight against climate change..."

Click on the picture above to follow the link to The Independent
to find out more...

Wednesday, January 30, 2008

A guide to level marking...

Use the information on this page to solve the mystery of LEVEL MARKING...

Remember...the truth is out there...

Questions from recent GCSE examinations will be tackled by the geogeordie in an attempt to show you the style of answer that would get you marks in each of the three different levels:


Basic (1-2 marks) or (1-3 marks)
Clear (3-4 marks) or (4-6 marks)
Detailed (5-6 marks) or (7-8 marks)


Let's see examples of answers to the following question:

Using examples of earthquakes, explain why some cause more deaths than others (6 marks)

Pupil X wrote...

"If the earthquakes are really big more houses will fall down than with small earthquakes so more people will die. And if there are lots of people in a city then there will be more deaths than if you were in a field."

Notice the simple statements and lack of examples


Pupil Y wrote...

"If an earthquake is large (high on the Richter Scale) it is likely to cause more deaths than if it is small. Some earthquakes happen in LEDCs where the buildings are not built as well and so collapse more easily killing more people. This happened in Bam, Iran in December 2003. Also, if an earthquake hits a city, more people will die as there will be a greater population density than in the countryside."

Notice the use of clear statements that are explained in more detail. An example, although brief, is also used.


Pupil Z wrote...

"Earthquakes that hit poor, less wealthy areas of a country do more damage, as seen in Bam, Iran in 2003, where an earthquake at 6.5 on the Richter Scale killed thousands. The people died because poor quality houses made from mud and wood crumbled under the shaking, creating dust which prevented breathing, and debris that crushed people. Three days previously, a quake also measuring 6.5 on the Richter Scale hit the USA. It killed only 3 people, because buildings are built with iron and steel frames, as well as reinforced concrete, and as a result buildings remained standing causing less deaths. Alaska, in 1964 which was a huge earthquake, killed only 131 people due to such a low population density. On the other hand, Japan, 1995, the death toll was 5500 as the quake hit a major city in which population density was very high. Another reason for more deaths is resources, as seen in Afghanistan in 2003. A level 6 quake on the Richter Scale killed 2000 and 3000 were injured. Resources were scarce, resulting in rescue teams not having the means to gain access."

Notice how this answer is made up of many clear statements. This answer is detailed and makes good use of examples. There is also a good structure (three main points with associated examples).

Improve your GCSE exam answers...

Using an example of a flood in a MEDC, describe its effects on the land and people (4 marks)

In 1993 the River Mississippi (USA) flooded after 50 days of very heavy rain. Both farmers and their land were affected since 6 million acres of farmland were flooded, ruining maize crops. Millions of tonnes of silt were deposited by the floodwater covering a huge area of land which then needed to be cleared afterwards. More than 36,000 people lost their homes, many thousands more needed to be evacuated and 28 people were killed.

geogeordie writes: "This answer would have got full marks. It gets the example (bold type) out of the way in the first few words - the examiner is left in no doubt that you're on the ball! It then clearly describes a number of effects (bold type) on the land AND the people - a failure to deal with both of these would have lost you marks."


LEDCs often have youthful populations, whereas MEDCs' populations are often ageing. Describe the problems which may result from this (6 marks)

In LEDCs there is a larger proportion of young people compared with old people. This puts pressure on basic health care and education services - local authorities having to find the money for medicines, medical staff, schools, teachers and so on. Often, children in MEDCs cannot extend their education beyond primary school because of a lack of funding. Time and money also needs to be put into the establishment of clean water supplies since, without them, further disease will result in even greater pressure on the basic health care services.

In MEDCs the proportion of older people is growing creating a significant financial burden. This is a problem because once retired, these people are receiving money (via pensions) but not putting any back (via tax on their earnings). An ageing population is also a problem because old people tend to require either more complex or more regular health care as well as suitable accommodation (e.g. sheltered housing). This all costs money - money that comes from an increasingly smaller work force (economically active population) who end up trying to support an increasingly larger dependant population of elderly people.

geogeordie writes: "This answer is certainly a Level 3 answer. There is balance in the answer since there is reference to both MEDC and LEDC issues. Key terms (underlined) show the examiner that you know what you are talking about. Examples are also given (e.g. sheltered accommodation) not simply implied. Perhaps the style could be altered to make it even better - rather than two paragraphs, comparative points (linkages) could be made."


There are several different types of subsistence farming (e.g. intensive rice cultivation, shifting cultivation). For one or more types of subsistence farming, describe and explain the problems faced by farmers and any recent changes which have occurred (8 marks)

On the flood plain of the River Ganges (India) subsistence rice farming takes place. Usually, the flooding of the River Ganges is useful (providing water and fertile silt). However, if the floodwater rises too high, catastrophic floods can create a real problem, destroying the rice crop entirely and leaving the farmers with no food for their families. In turn, this could lead to problems of malnourishment and/or starvation. Too little rain is as much of a problem as too much rain - when the monsoon rains "fail", there is not enough water for the rice to grow properly and the crop is lost.

Rapid population growth is also a major problem with too few fields trying to support too many mouths. Furthermore, there are many landless peasants who do not have the potential to grow their own food since the land is owned by large landowners. Even when land is owned by a family, further problems are faced by the farmers - traditionally when the father dies, the land is subdivided and passed on to his sons. This results in the creation of plots that are simply too small to support a family.

Recent changes have taken place in India with respect to the people and the farming practices. Frustrated, landless peasants have decided to "try their luck" in major urban areas resulting in a loss of young people from rural rice farming areas. A major change was the introduction of the Green Revolution in the !960s. High Yielding Varieties (HYVs) of rice were introduced which not only increased yields but also allowed a second crop to be grown (double cropping). Irrigation schemes were introduced (to ensure a more regular water supply), tractors were used instead of water buffalo (for power in the fields) and grants were made available for the purchase of new seeds and equipment.

geogeordie writes: "An answer worthy of the full eight marks. Both problems and changes covered in detail. The example is used to good effect and shows a detailed understanding - it is not simply "tagged" on. Note also how the answer keeps referring back to the question - a good strategy to help you and the examiner keep on track."

examGURU

If you know your stuff but don't know how to get it down on paper, then read on...let examGURU ease the stress of exams and put YOU in control of your revision.

Take on board this advice - if you fail to prepare, prepare to fail!


So what exactly is examGURU?

It's simply a collection of answers to frequently asked questions and solutions to ongoing problems.

The information on this page is regularly updated and is based on the real life experiences of students like YOU.

All advice below is the result of previous experiences, class discussion, exam marking or pupil queries.

geoGEORDIE examGURU gives it to you straight!

What do you mean "I didn't answer the question?"

Your answer lacked focus and included too much waffle! Don't fall into the trap of answering the question that YOU want to...do exactly what the examiner says. If they want causes, give 'em causes (and don't write about effects!). If they want you to use examples then don't just use one!

When there's a graph or a map, how do I describe it to get the full 3 marks?

It's simple...get into the habit of remembering to wear your thinking H.A.T. (Highs 'n' Lows, Anomalies, Trends).

Describe simply means "say what you see" (yes...I've watched Catchphrase too!). So, write down which part of the graph has the highest figure and/or the lowest, pick out anomalies (i.e. pieces of data that don't seem to fit in with the rest) and identify overall patterns/trends (i.e. is there a negative or positive correlation).

Areas of No data may also be noteworthy (or if a choropleth map has a key with high and low population density shaded, anything blank on the map is probably medium population density).

Remember, too, that you must refer to the data on the graph or map.
ABOVE ALL...do not explain if the question simply wants you to describe.

Are case studies really that important?

You bet they are! Without them you'll be lucky to scrape a C grade.

Make sure that you use the right case studies for the right question and for goodness sake get 'em right - for example, don't write about "India's One Child Policy" when you mean "CHINA's One Child Policy".

With respect to detail, in a question requiring an example of a city you've studied in an MEDC, you'll get much more credit for "Leeds, West Yorkshire, UK" than you will for "Leeds".

Oh...and never fall into the trap that geoGURU likes to call the "e.g. Africa syndrome" - your case studies should always be tightly focussed and specific.

These may seem like little things but the examiners keep on saying that, if you get them right, they make a BIG difference.

But that's what I've said isn't it? What do you mean use key vocabulary?

Many students miss out on the highest level of marks in the 6 and 8 marks questions because they do not use an advanced geographical vocabulary.

Think about it...you wouldn't be too impressed if someone was speaking about Premiership football and referred to the "relegation zone" as the "part of the league where the teams that aren't very good (and will end up in the next league down) can be found". It might be right, but it's waffle, it's long-winded and it's wasting valuable space and time.

There is a better way of putting it, so why not use it!

So, don't refer to the "middle of the city"...write about the "CBD"; forget about a river "wiggling as it goes through an area which might get flooded" and write about "a meandering channel working its way across a flood plain"; and avoid using "the number of people who can read and write" when you really mean the "literacy rate".

Choosing the right question...

When you are presented with a choice (e.g. between Settlement and Population), choose carefully.

My advice is to look at the 6 or 8 mark questions first - if you can do them then you're on the way to success!

Don't get carried away with the first few questions and think "Great...this is easy" - things will get harder and to get the top grades, you need to be getting top marks for the more difficult questions.

So...I missed off the units..big deal!

It can be a VERY big deal and can result in so-called "easy marks" being thrown away.

So, for example, if you're writing a temperature, put the symbol for degrees centigrade after the number. If you're writing about a distance, include metres or kilometres.

Don't just read the questions carefully - read EVERYTHING carefully

Under the pressure of an exam room, there is always the temptation to "dive in" and get writing straight away.

DON'T.

Instead, read the question, read all the data (tables, graphs etc.) that might go with it and then read the question again.

This won't take long and will actually give your brain some breathing space in which to start formulating a high quality answer.

It will also stop you from going off on a tangent and losing marks for irrelevant information.

What exactly are command words?

They are the words that are at the beginning of the question and it is VITAL that you understand what they mean the examiner wants you to do.

geoGURU likes to call this "understanding examspeak" - half the battle is being confident that you know what is being asked of you.

So, for example, make sure that you know the difference between "describe" and "explain" and what you need to do when asked to "suggest reasons"...

This is Geography not English...

Maybe...but unless you can write clearly and get your point across you won't get many marks.

DO NOT presume that the examiner knows what you mean - don't hold back...give it to 'em straight!

You must write down exactly what you want to say even if you think it's stating the obvious.

So many marks are lost as a result of students thinking "it can't be that straightforward" or "he/she will know what I mean"...DON'T FALL INTO THAT TRAP!

The Holderness Coast - change over time...

The AQA A2 Specification states that students must:
"study a small-scale coastline, using OS maps and other historical evidence if available to analyse changes over time"

Don't forget that this case study will also help you to learn about features of erosion and deposition as well coastal problems and coastal management (in other words, lots of the other sections of the Specification!)

In addition to the paper resources that I will give to you, make sure that you make use of the following electronic resources:

An outstanding site is provided by Hull University and can be found at http://www.herb.hull.ac.uk/erosion/html/geography.html

This is suggested by "Kay" whose AS/A2 website is top notch for coasts (and lots of other topics)

A jolly little intro to Holderness is provided at

Detailed rates of erosion (and lots of other info) are provided by http://www.nerc.ac.uk/lois/coastl.shtm

Useful links, photos and a whole lot more can be found at http://www.geographypages.co.uk/holderness.htm

And finally...a smashing set of annotated photos can be found at http://www.holgate.info/Environmental%20pages/EcoHolgate/fieldwork/Processes/coastpics.htm

Climate Change - Y11 Activity

The syllabus states that:
"Students should be aware of the conflicting nature of the evidence for and against global warming".

Your task is to produce a report entitled
"The Greenhouse Effect:
Fact or Fiction?"
  • Begin by...including an introduction in which you explain about the NATURAL Greenhouse Effect and then discuss the ENHANCED Greenhouse Effect (diagrams would be useful here)
  • Then...state the evidence from the scientific community that i) climate change is happening and the enhanced greenhouse effect is fact and ii) climate change is not happening and the enhanced greenhouse effect is fiction (think carefully about layout and presentation - make your text accessible to the reader via bullet points, tables, diagrams etc.)
  • Finally...evaluate this evidence and come to your own conclusion using the evidence to support what you are saying.

Use the following PAPER RESOURCES:

1 GeoFile 386
2 GeoActive 202

Use the following WEBSITES:

Background Information:

http://www.bbc.co.uk/climate/


Evidence FOR:

http://www.ucsusa.org/global_environment/global_warming/index.cfm

http://www.foe.co.uk/campaigns/climate/issues/climate_change/index.html

http://www.worldwildlife.org/climate/

http://www.guardian.co.uk/climatechange/0,12374,782494,00.html

http://www.pbs.org/wgbh/warming/

http://www.climatehotmap.org/euroruss.html


Evidence AGAINST:

http://space.newscientist.com/article/mg16221923.000-greenhouse-sceptics.html

http://news.bbc.co.uk/1/low/in_depth/629/629/7074601.stm

http://news.bbc.co.uk/hi/english/sci/tech/newsid_467000/467007.stm

http://www.john-daly.com/

http://epa.gov/climatechange/index.html